Editor's Note: For a long time, Fintech and DeFi have been seen as two separate financial systems: one is compliant, centralized, and can be valued; the other is open, runs on-chain, and more like public infrastructure. Fintech excels at turning traffic into revenue, while DeFi excels at maximizing efficiency. As tokenization, stablecoins, and on-chain transactions continue to penetrate the traditional system, integration has become inevitable. So, what is the future of finance: building toll booths on the open road, or will the toll booths eventually learn to walk the open path?
This article compares and analyzes Fintech and on-chain protocols from four dimensions: revenue, scale, user numbers, and take rate, attempting to answer whether DeFi will win or Fintech will win?
Below is the original text:
Gm, Fintech architects, today we bring you some truly heavyweight content.
In collaboration with analytics firm Artemis (known as the "Bloomberg Terminal for digital finance"), we are officially releasing the first-ever comparative analysis of key metrics (KPIs) between Fintech and DeFi.
If you've ever struggled with whether to invest in Robinhood or Uniswap, you've come to the right place.
Summary
We placed fintech stocks and crypto tokens on the same "comparison table," a true side-by-side comparison on the same page.
Covering multiple sectors including payments, digital banking, trading, lending, and prediction markets, we compared revenue, user scale, take rate, key industry metrics, and valuation metrics.
The results were quite surprising:
Hyperliquid's trading volume has reached over 50% of Robinhood's
The lending volume of DeFi protocol Aave has surpassed that of buy-now-pay-later platform Klarna
The growth rate of stablecoin payment channels is far faster than that of traditional payment service providers
The user scale of wallets like Phantom and MetaMask is already comparable to that of neobanks like Nubank and Revolut
We found that valuations truly reflect this tension: crypto assets are either heavily discounted due to uncertainty about "how to monetize in the future" or given extreme premiums due to high expectations.
Ultimately, we raise a core question about "convergence": Will the crypto world learn to build tollbooths, or will fintech ultimately adopt crypto's open payment and clearing rails?
Entities Involved
Block, PayPal, Adyen, Tron, Solana, Coinbase, Robinhood, Uniswap, Aave, Affirm, Klarna, Polymarket, DraftKings
Two Financial Systems
For years, we have viewed the crypto world and fintech as two parallel universes: one is regulated, audited, and traded on NASDAQ; the other is a permissionless system where assets circulate on decentralized and centralized exchanges.
They use the same language—revenue, trading volume, payments, lending, trading—but with distinctly different "accents." And this landscape is changing.
As Stripe acquires Bridge, Robinhood launches prediction markets, and PayPal begins issuing its own dollar stablecoin, the boundaries between the two systems are gradually blurring.
The real question is: When these two worlds truly meet and collide, how should they be compared on the same comparison table?
So, we decided to run an experiment.
We selected the fintech companies you know—covering payment processors, neobanks, buy-now-pay-later (BNPL) providers, and retail brokers—and paired them with their crypto-native counterparts.
In the same set of charts, we compared them using the fintech metrics you're already familiar with (like P/S, ARPU, TPV, user count, etc.): green bars represent stocks, purple bars represent tokens.
From this, a picture of two financial systems emerged: On-chain financial protocols often match or even exceed their fintech peers in terms of trading volume and asset scale; but the economic value they capture is only a small fraction; crypto asset pricing relative to comparable fintech companies is either extremely premium or deeply discounted, with almost no "middle ground"; and the gap in growth rates between the two is stark.
Payments: The "Pipes" for Fund Flows
Starting with the largest sector in fintech—moving money from point A to point B.
On the green side, there are true giants:
PayPal: Processes $1.76 trillion in payment volume annually
Adyen: Processes $1.5 trillion
Fiserv: This "infrastructure company no one mentions at the party" processes $320 billion
Block (formerly Square): Drives $255 billion in fund flows through Cash App and its merchant network
These companies form the most mature and stable "funds pipeline layer" in the traditional fintech system.
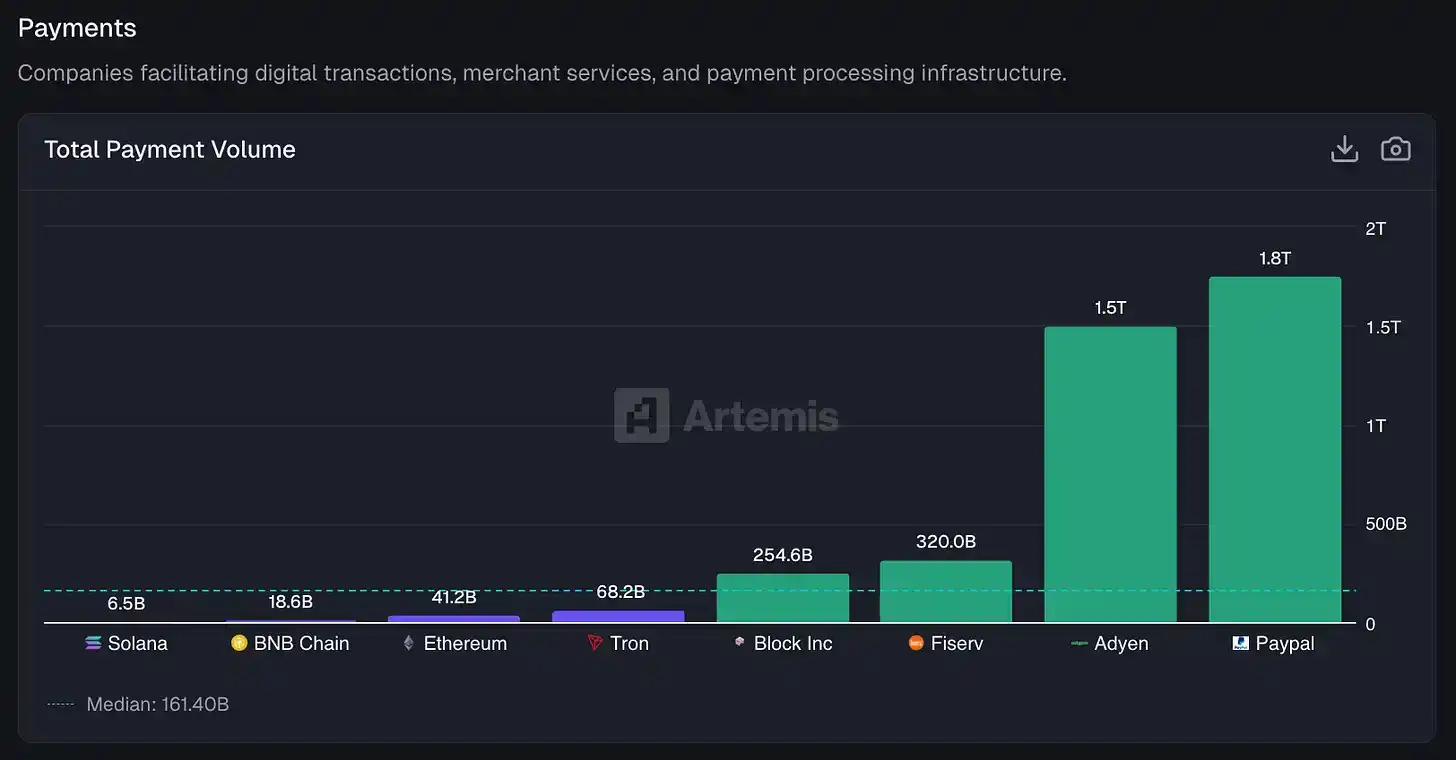
On the purple side, here are the annualized B2B payment volumes estimated by Artemis's stablecoin team:
Tron: $68 billion in stablecoin transfer volume
Ethereum: $41.2 billion
BNB Chain: $18.6 billion
Solana: Approximately $6.5 billion
In absolute terms, they are not on the same scale. The combined stablecoin transfer volume on all major public chains is only about 2% of the scale of fintech payment processors. If you squint at that market share chart, the purple bars are almost just a rounding error.
But the really interesting part is—the growth rate.
PayPal's total payment volume grew only 6% last year
Block grew 8%
Adyen, Europe's "darling," achieved 43% growth—quite strong by fintech standards
Now look at the blockchains:
Tron: Grew 493%
Ethereum: Grew 652%
BNB Chain: Grew 648%
Solana: Grew 755% year-over-year, the fastest
Again, this data comes from the Artemis data team's estimates of B2B payment volume based on McKinsey research.
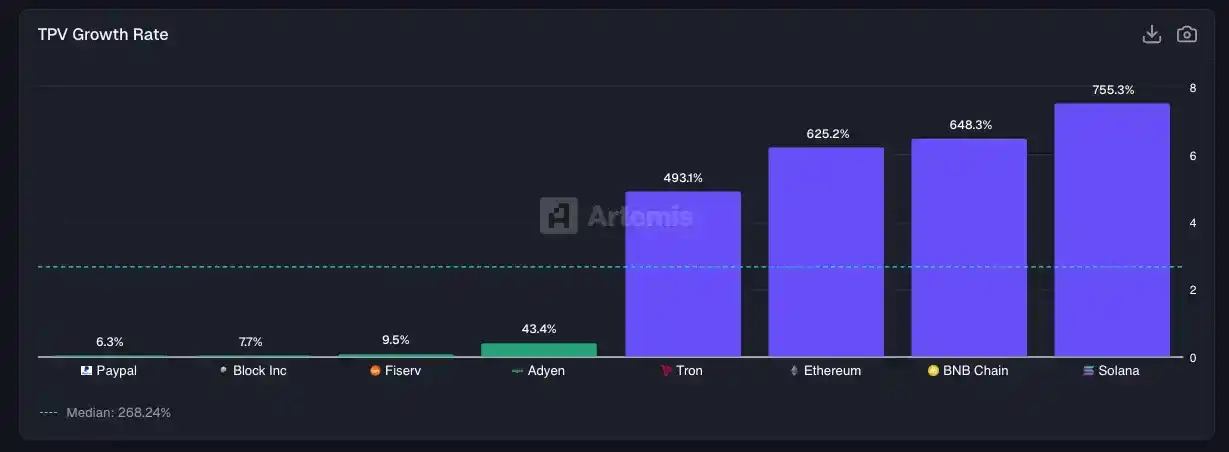
The results are very clear: The growth speed of the stablecoin "payment rails" is far faster than that of the traditional fintech payment system.
Of course, their starting point is also much smaller.
Next, the question becomes: Who is actually capturing the economic value?
Fiserv: Takes 3.16% for every dollar it handles
Block: Takes 2.62%
PayPal: Takes 1.68%
Adyen: Due to its lower-margin enterprise model, takes only 15 basis points (0.15%)
These are real business companies. Their revenue is directly and stably tied to payment volume.
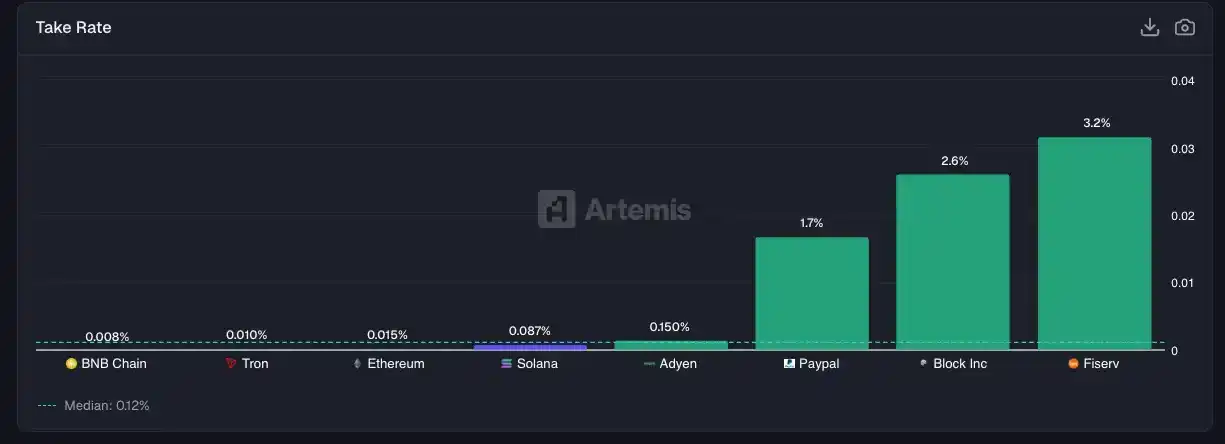
As for the blockchain side, their take rate on stablecoin transfers and broader asset transfers is much lower, roughly between about 1–9 basis points (bps). Tron covers stablecoin transfer costs by charging users TRX, while Ethereum, BNB Chain, and Solana charge end users gas fees or priority fees.
These public chains are very strong at facilitating transfers and driving asset movement, but they take a much smaller cut compared to traditional payment service providers. Avoiding things like interchange fees and merchant fees is one of the key reasons blockchain can claim huge efficiency advantages over existing payment systems.
Of course, there are also many on-chain payment orchestrators happy to layer additional fees on top of the base fees—this precisely constitutes a major opportunity for "facilitators" to build economic value on top.
Neobanks: Wallets Become the New Bank Accounts
In the fintech neobank sector, there are real banks (or banks that "rent licenses"), such as Revolut, Nubank, SoFi, Chime, Wise. These institutions have licenses, deposit insurance, and compliance departments.
On the crypto side, we see wallets and yield protocols, like MetaMask, Phantom, Ethena, EtherFi. They are certainly not "banks," but millions of people store assets here; and increasingly, people are earning yield on their savings here. Even if the regulatory shell is different, this functional comparison still holds.
Start with user scale: Nubank has 93.5 million monthly active users (MAU), making it the world's largest digital bank, a scale built on high smartphone penetration in Brazil and an extremely complex local banking system; Revolut has 70 million users in Europe and beyond; Next is MetaMask, with about 30 million users—a scale that already surpasses Wise, SoFi, and Chime.
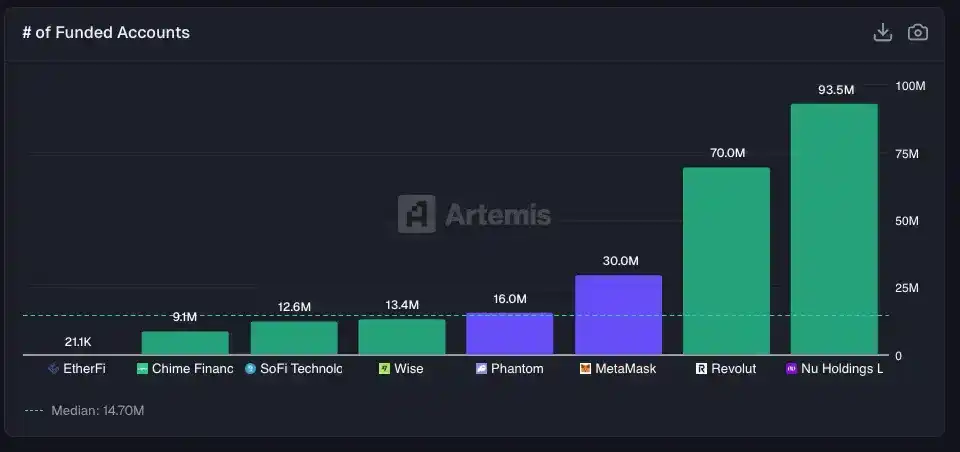
It should be noted that most MetaMask users are not using crypto wallets to pay rent, but to interact with DEXs or participate in lending protocols. Another leading wallet, Phantom, has 16 million monthly active users. Phantom was positioned as the best-experience wallet in the Solana ecosystem but quickly expanded to multiple chains, now offering its own stablecoin $CASH, debit cards, tokenized stocks, and prediction markets.
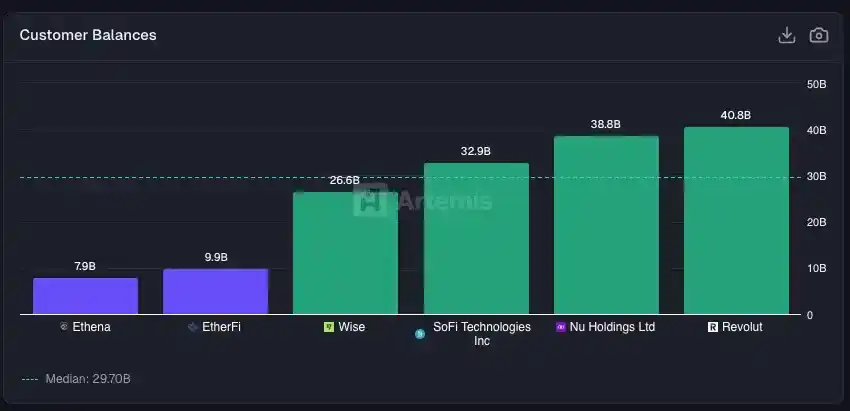
Now, look at where the money is kept.
Revolut: Customer balances of $40.8 billion
Nubank: $38.8 billion
SoFi: $32.9 billion
These are real deposits, generating net interest income for the institutions.
In the crypto world, there are highly similar counterparts:
Ethena: This synthetic dollar protocol, which didn't exist two years ago, now holds $7.9 billion
EtherFi: Scale of $9.9 billion
These are not "deposits," but staked assets, yield-bearing positions, or liquidity parked in smart contracts—in industry terms, called TVL (Total Value Locked).
But from the user's perspective, the logic is not fundamentally different: Money is placed somewhere and is continuously yielding.
The real difference is: How do these platforms monetize "stored funds," and how much money can they make from users?
SoFi: $264 annual revenue per user. This is not surprising—SoFi aggressively cross-sells between loans, investment accounts, and credit cards, and its user base has higher overall income.
Chime: $227 per user, revenue mainly from interchange fees.
Nubank: Operating in Brazil, a market with lower GDP per capita, $151 per user.
Revolut: Despite its large user base, only $60 per user.
What about EtherFi? $256 per user, almost on par with SoFi.
The downside for this crypto newcomer: EtherFi has only about 20,000 active users, while SoFi has 12.6 million.
That is, this DeFi protocol achieves monetization efficiency on a tiny user base comparable to that of the top digital banks with massive user scales.
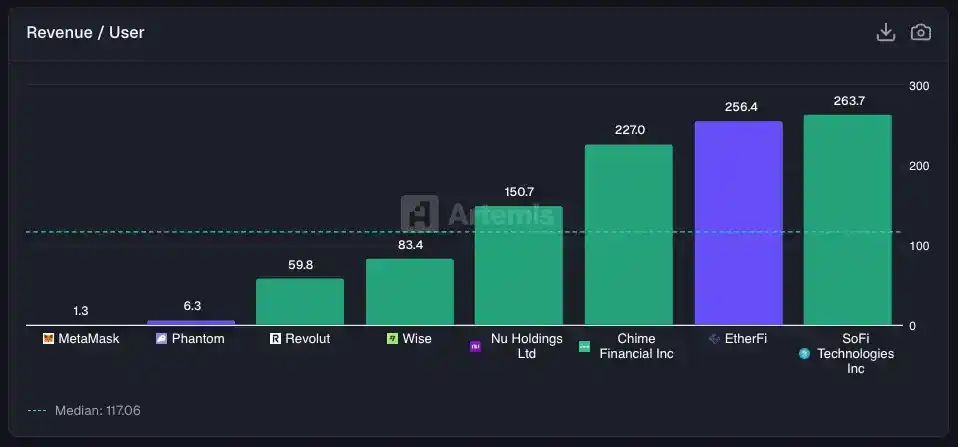
From another perspective, MetaMask generated about $85 million in revenue last year, translating to an ARPU of about $3, even lower than Revolut's early stages.
Ethena, while having $7.9 billion in TVL, still has user reach that is just a fraction of Nubank's.
Valuation is a direct reflection of this "growth vs. monetization ability" tension.
Revolut is valued at about 18x revenue, a pricing that reflects its market position and the "option value" of future expansion; EtherFi is valued at about 13x; Ethena at about 6.3x, roughly the same level as SoFi and Wise.
A rather counterintuitive conclusion is emerging: The market is valuing DeFi / on-chain "banks" and traditional fintech banks in quite similar ways at the valuation level.
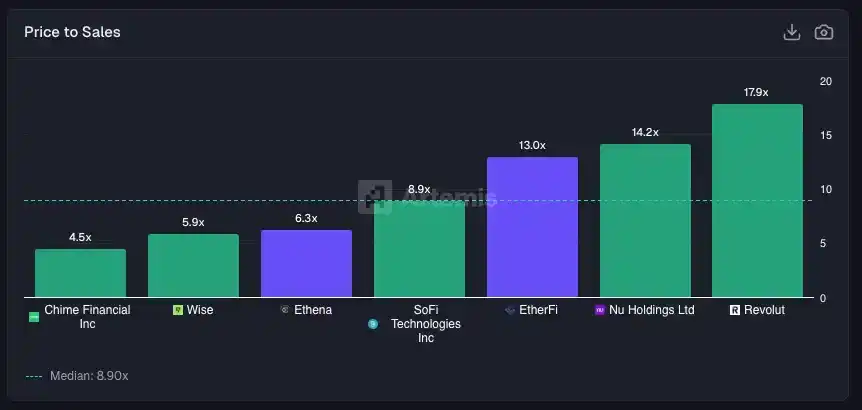
The so-called "convergence thesis" refers to: Wallets will eventually evolve into digital banks.
We are already seeing concrete manifestations of this trend: MetaMask launched a debit card, Phantom integrated fiat on/off ramps. The direction is clear, just still on the road.
But when an on-chain "digital bank" like EtherFi already has higher revenue per user than Revolut, the gap between the two is actually not as big as the narrative suggests.
Trading: On-Chain DEXs Are Catching Up to Traditional Brokers
Switching perspective to capital markets.
What truly surprised us was: The trading volume of on-chain exchanges can already be mentioned in the same breath as traditional brokers.
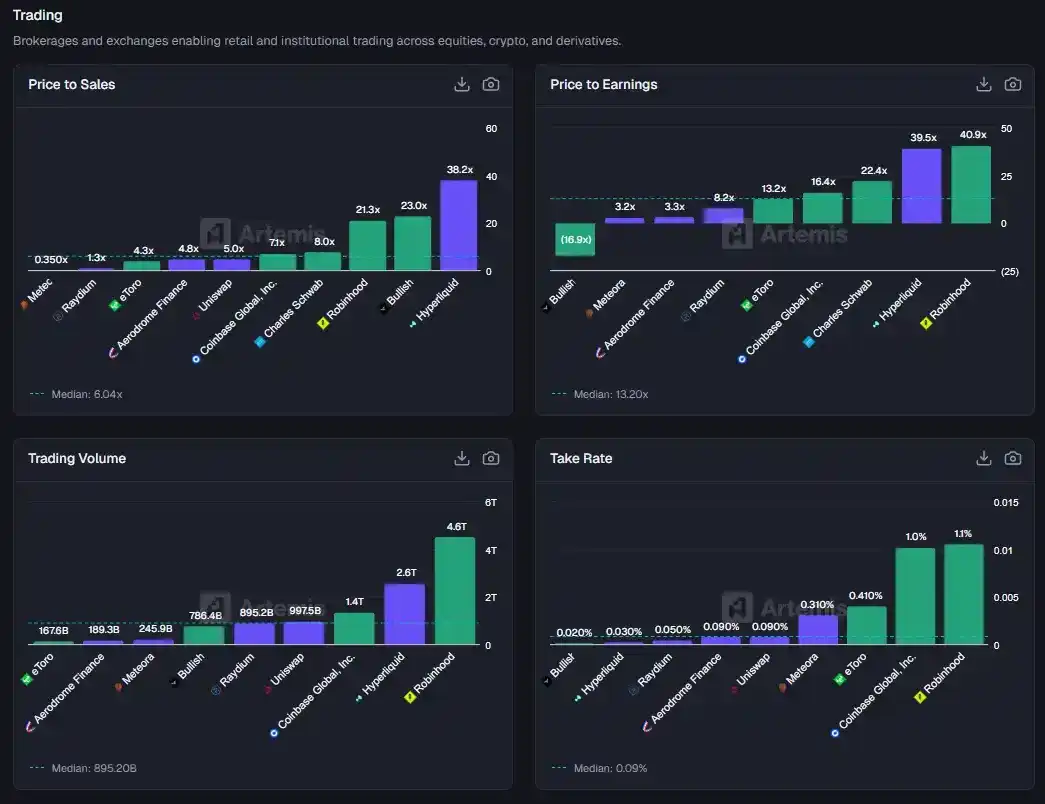
Robinhood processed $4.6 trillion in trading volume over the past 12 months, mainly from stocks, options, and crypto assets, corresponding to an asset scale of about $300 billion (give or take).
Hyperliquid's spot and perpetual contract trading volume is about $2.6 trillion, mainly driven by crypto trading, but stocks and commodities are starting to take share.
Coinbase's trading volume is about $1.4 trillion, almost entirely from crypto assets.
As the "old guard," Charles Schwab does not disclose trading volume in the same way, but its $11.6 trillion in assets under custody is enough to illustrate the volume gap between new money and old money—about 40 times that of Robinhood.
This outlines a clear contrast: On-chain trading has caught up to mainstream brokers in terms of "flow," but in terms of "stock of assets," the traditional system still holds an overwhelming advantage.
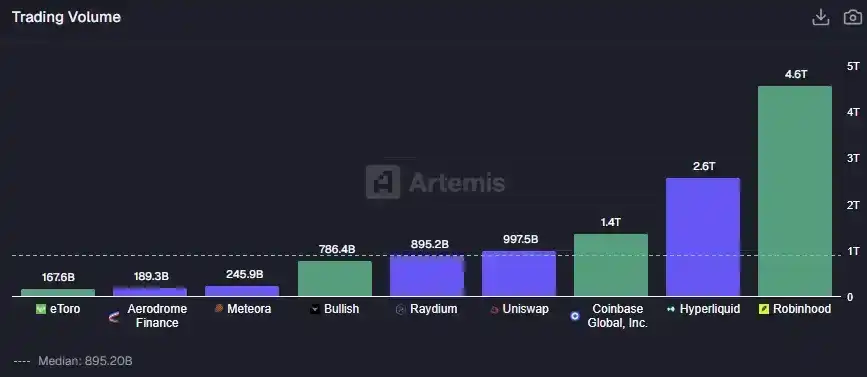
Other decentralized exchanges are also not to be ignored. For example, Uniswap, the protocol that proved automated market makers (AMMs) work, has nearly $1 trillion in trading volume; Raydium (a leading DEX on Solana) did $895 billion; Meteora and Aerodrome together contributed another $435 billion.
Combined, the processing scale of major DEXs is already comparable to Coinbase. Three years ago, this was almost unimaginable.
Of course, we don't know how much of this volume is wash trading and how much is real trading; but the trend itself is key. Additionally, while the "convergence" of volume is real, DEXs and traditional brokers have fundamental differences in take rate.
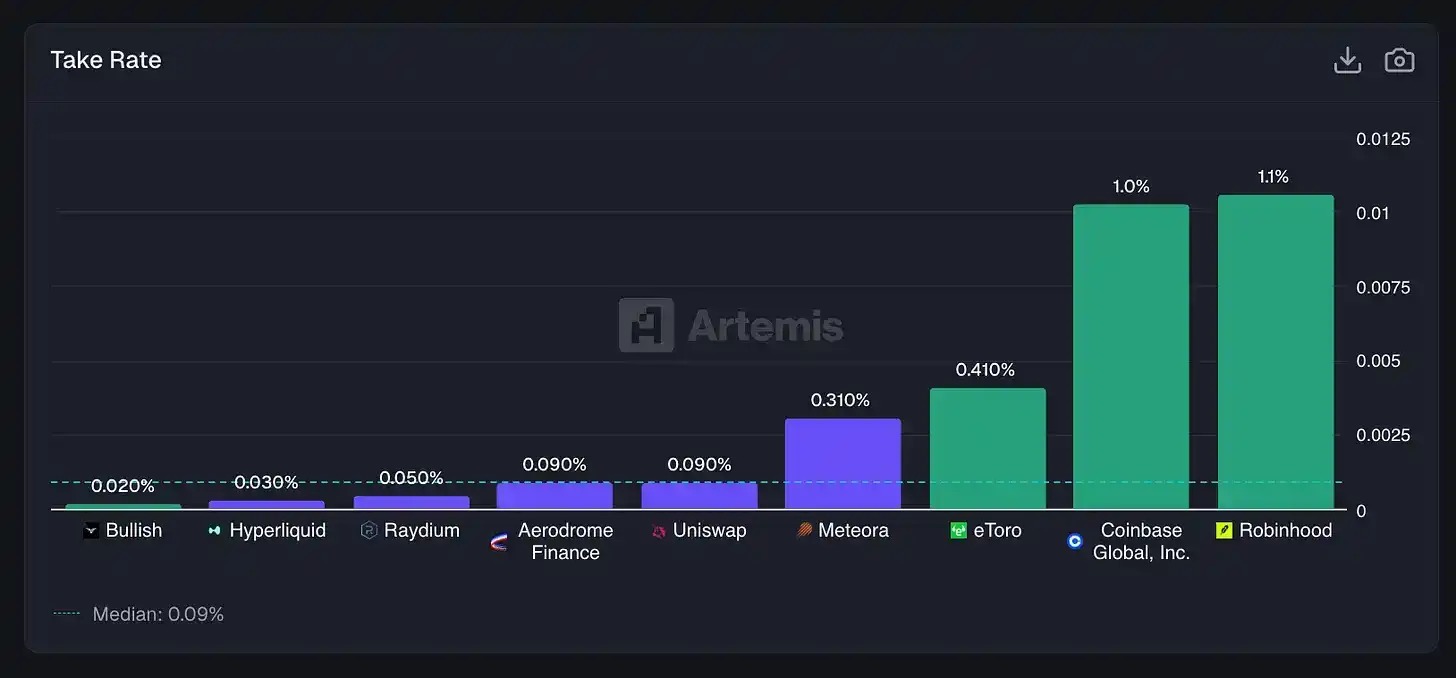
Traditional brokers / centralized platforms:
Robinhood: Takes 1.06% per trade, mainly from payment for order flow (PFOF) and crypto spreads
Coinbase: About 1.03%, high spot fees are still common on centralized exchanges
eToro: Even so, 41 basis points
DEXs operate in a completely different universe:
Hyperliquid: 3 basis points
Uniswap: 9 basis points
Aerodrome: 9 basis points
Raydium: 5 basis points
Meteora: 31 basis points (a clear exception)
Decentralized exchanges can generate extremely high trading volumes, but due to fierce competition for liquidity providers (LPs) and traders, their take rates are significantly compressed.
This is quite similar to the division of labor logic in traditional markets: Real exchanges (like NASDAQ, Intercontinental Exchange) and brokers who bring clients to the trading venue inherently undertake different functions.
This is the paradox of DEXs.
DEXs have built trading infrastructure that can compete head-to-head with centralized exchanges in terms of volume: running 24/7, almost no downtime, no KYC required, anyone can list a token. But on $1 trillion in trading volume, even a 9 basis point take rate means Uniswap can only generate about $900 million in fees, about $29 million in revenue; whereas on $1.4 trillion in volume, a 1% take rate gives Coinbase $14 billion in revenue.
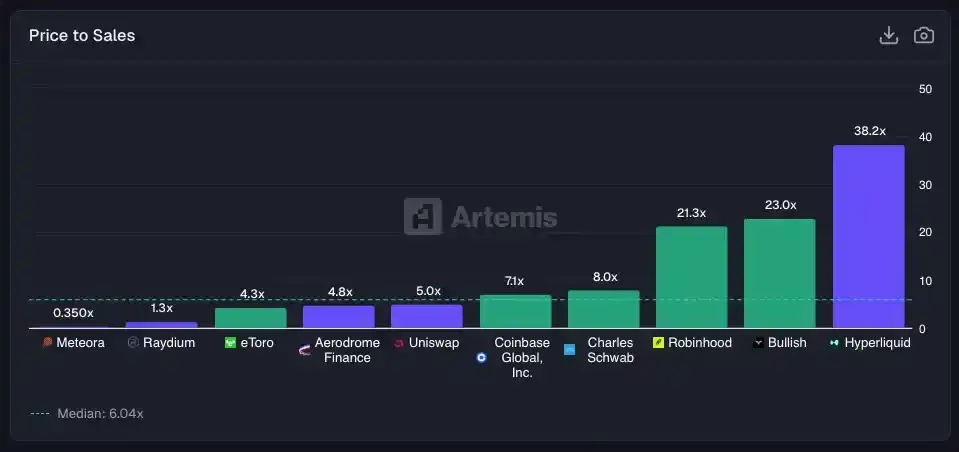
This difference is faithfully reflected in market valuations:
Coinbase: 7.1x Sales
Robinhood: 21.3x (high for a broker, but supported by growth)
Charles Schwab: 8.0x (mature multiple for a mature business)
Uniswap: 5.0x Fees
Aerodrome: 4.8x Fees
Raydium: 1.3x Fees
The conclusion is not complicated: The market is not pricing these protocols as "high-growth tech companies," one important reason being—compared to traditional brokers, their take rates are lower, so the economic value they capture is also less.
Looking at stock performance, the flow of market mood is clear.
Robinhood has risen about 5.7x since late 2024, benefiting from the resurgence of retail investment and the crypto market rebound; Coinbase is up about 20% over the same period; while Uniswap, the protocol that "spawned a thousand DEX forks," has seen its stock (token) price fall 40%.
Despite massive trading volume continuously flowing through these DEXs, the related tokens have not captured value to the same extent, partly because their "utility" as investment tools is not clear enough.
The only exception is Hyperliquid. Due to its explosive growth in scale, Hyperliquid's performance has almost synchronized with Robinhood, achieving similar gains over the same period.
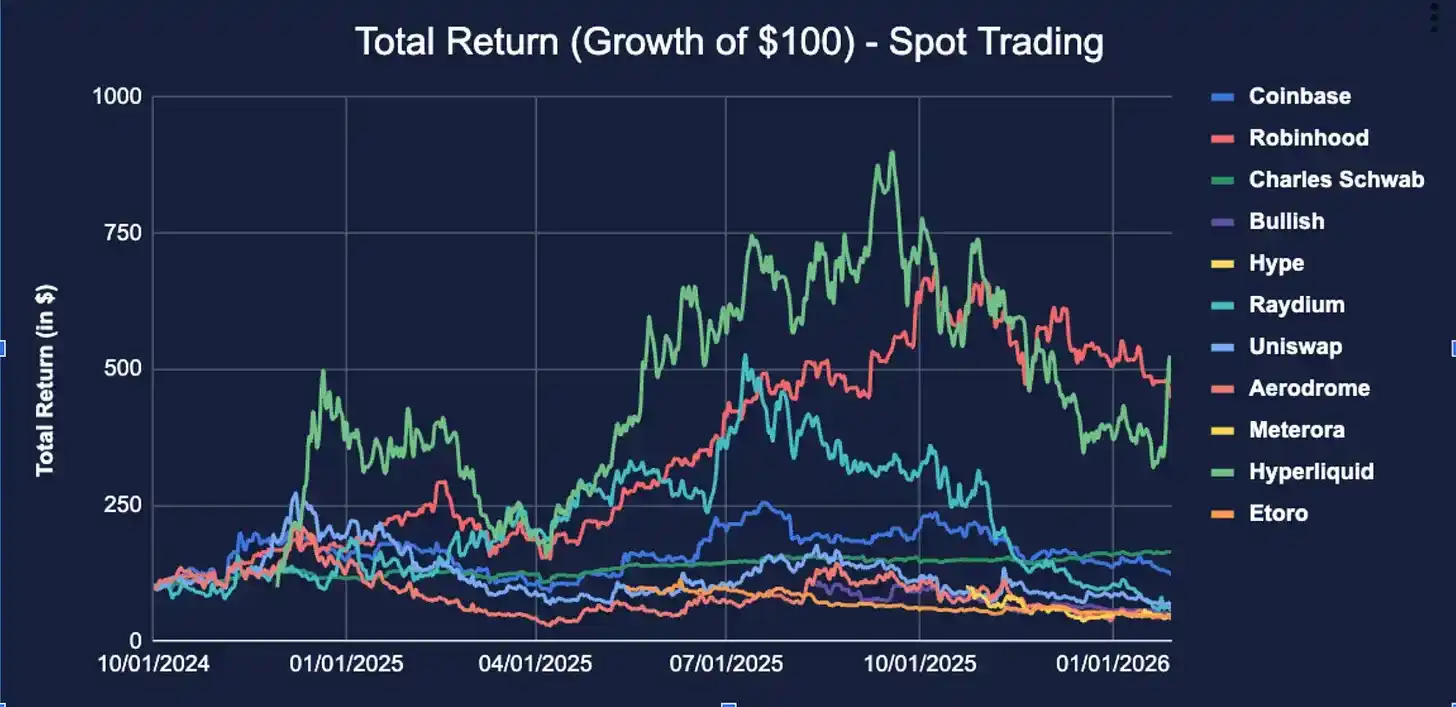
Although historically, DEXs have struggled to capture value and are often seen as public goods, projects like Uniswap have begun to turn on their "fee switch"—using fees to buy back and burn UNI tokens. Currently, Uniswap's annualized revenue is about $32 million.
We are optimistic about the future: As more and more trading volume migrates on-chain, value is expected to gradually flow back to DEX tokens themselves, with Hyperliquid being a successful example.
But for now, until token holders achieve a clear, direct value capture mechanism similar to Hyperliquid's, DEX token performance will still lag behind that of centralized exchange (CEX) stocks.
Lending: "Underwriting" for the Next Generation Financial System
In the lending segment, the comparison becomes even more intriguing.
On one side, is the core business of fintech—unsecured consumer credit:
Affirm: Lets you split a Peloton bike into four payments
Klarna: Provides the same installment service for fast fashion
LendingClub: Pioneered the P2P lending model, later transformed into a real bank
Funding Circle: Does loan underwriting for SMEs
These companies make money in a highly consistent way: Charge borrowers an interest rate higher than the cost paid to depositors, and pray the default rate doesn't eat up this spread.
On the other side, is collateralized DeFi lending: Aave, Morpho, Euler
Here, borrowers collateralize ETH, borrow USDC, and pay an algorithmically determined interest rate; if the collateral price falls to a dangerous level, the protocol automatically liquidates—no collection calls, no bad debt write-offs.
These are essentially two completely different business models, they just happen to both be called "lending."
Start with loan scale
Aave's outstanding loan volume is $22.6 billion
This already exceeds the sum of the following companies:
Klarna: $10.1 billion
Affirm: $7.2 billion
Funding Circle: $2.8 billion
LendingClub: $2.6 billion
The loan scale of the largest DeFi lending protocol has surpassed that of the largest BNPL platform.
Please stop and seriously absorb this fact.
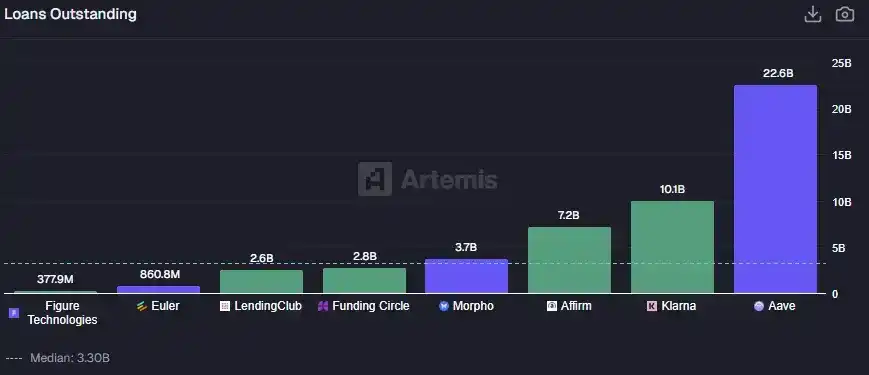
Morpho adds another $3.7 billion. Euler, after restarting following a hack in 2023, currently has a scale of $861 million.
Overall, the DeFi lending system has grown to a scale comparable to the entire listed digital lending industry in about four years—but its economic structure is inverted.
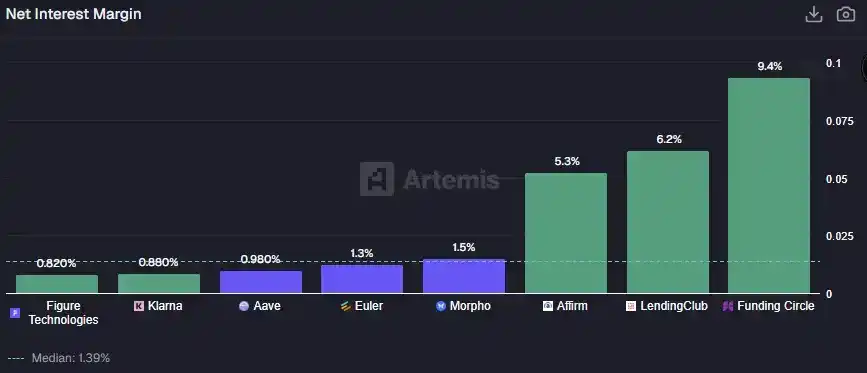
On the traditional fintech side: Funding Circle's "net interest margin" is 9.35% (related to its business model closer to private credit); LendingClub is 6.18%; Affirm, although a BNPL company rather than a traditional lender, still gets 5.25%.
These are quite "fat" spreads—essentially compensation for the credit risk they bear, personally conducting underwriting and risk control.
On the crypto side: Aave's net interest margin is only 0.98%; Morpho is 1.51%; Euler is 1.30%.
Overall, even with larger loan scales, DeFi protocols generally earn lower spreads than fintech lenders.
DeFi lending is designed to be over-collateralized.
To borrow $100 on Aave, you typically need to provide $150 or more in collateral. The protocol itself does not bear credit risk, but liquidation risk—a completely different nature of risk.
The fees paid by borrowers are essentially for leverage and liquidity, not for obtaining credit eligibility they otherwise couldn't have.
Fintech lenders are the exact opposite. They provide unsecured credit to consumers, satisfying "buy now, pay later" demand; the spread exists to compensate for those who simply won't repay.
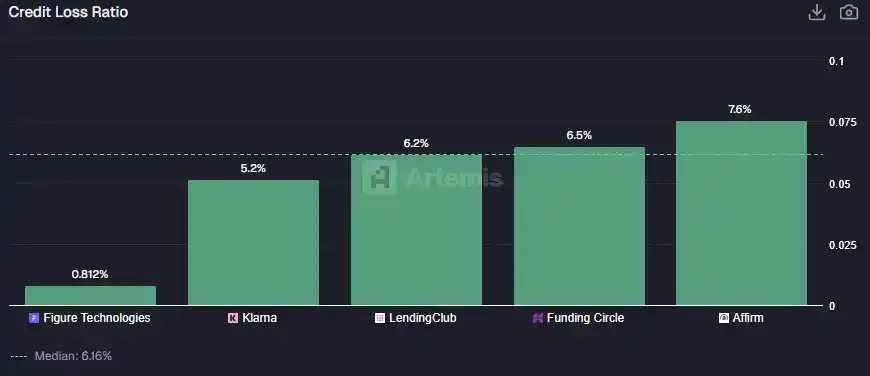
This is directly reflected in the loss data from actual defaults, and managing these default risks is the core work of underwriting.
So, which model is better? The answer depends on what you want to optimize for.
Fintech lending serves borrowers who don't have money now but want to consume first, so they must bear real underwriting and default risk. This is a brutal business. An early batch of digital lenders (like OnDeck, LendingClub, Prosper) have repeatedly teetered on the "brink of death."
Even if Affirm's business itself is running well, its stock price is still down about 60% from its all-time high—often because the market prices its underwriting revenue with SaaS valuation logic, without fully accounting for future inevitable credit losses.
DeFi lending is essentially a leverage business.
It does not serve "people without money," but users who already hold assets, don't want to sell, and just want to obtain liquidity, more like a margin account. There is no traditional credit decision here, the only criterion is the quality of the collateral.
This model is capital efficient, highly scalable, earning very thin spreads at enormous scale; but it also has clear boundaries—it's only useful for those already on-chain, with substantial assets, who want to earn yield or additional leverage without selling their assets.
Prediction Markets: Anyone's Guess?
Finally, let's look at Prediction Markets.
This is the newest battleground between Fintech and DeFi, and the strangest one. For decades, they were just academic "curiosities": economists loved them, regulators shunned them.
Iowa Electronic Markets ran election predictions on a small scale; Intrade had a brief boom before being shut down; more projects were directly classified as gambling or sports betting.
The idea of "trading real-world event outcomes, and these markets giving better predictions than polls or commentators"—remained theoretical for a long time.
This all changed in 2024 and accelerated during Trump's second term: Polymarket processed over $1 billion in election bets; Kalshi won its lawsuit against the CFTC and began offering political contracts to US users; Robinhood, as always unwilling to miss any trend, quickly launched event contracts; DraftKings, already effectively running a prediction market through daily fantasy sports, watched from the sidelines, sitting on a $15.7 billion market cap and $5.5 billion in annual revenue.
Prediction markets have finally moved from fringe experiments to the center stage of finance and crypto.

This sector went from niche experiment to mainstream in about 18 months—weekly prediction market trading volume has hit about $7 billion, setting new historical highs.
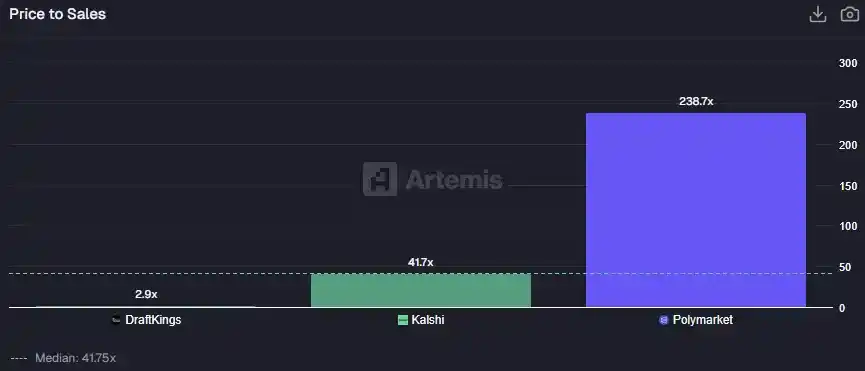
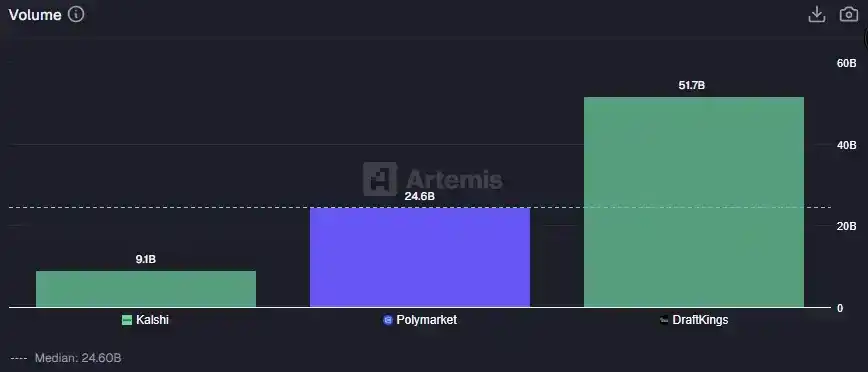
DraftKings had $51.7 billion in trading volume over the past 12 months; Polymarket reached $24.6 billion, about half of DraftKings, and it is still a crypto-native protocol, theoretically not allowed for US users; Kalshi, as a compliant US domestic alternative, had $9.1 billion in volume.
Just in terms of volume, Polymarket is quite competitive. It has built a liquid, global prediction market on Polygon, while Kalshi was still running between courtrooms for compliance qualifications.
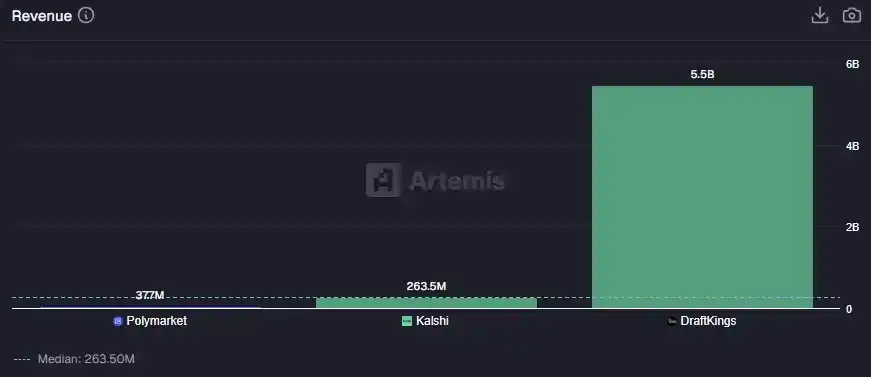
But when we turn to revenue, the comparison starts to become unbalanced.
DraftKings generated $5.46 billion in revenue last year; Kalshi only $264 million; Polymarket, after turning on taker fees for 15-minute crypto markets, achieved an annualized revenue run rate of about $38 million.
This again reveals a familiar divide: In "scale," DeFi has caught up; but in "monetization ability," traditional finance and betting companies still hold an overwhelming advantage.
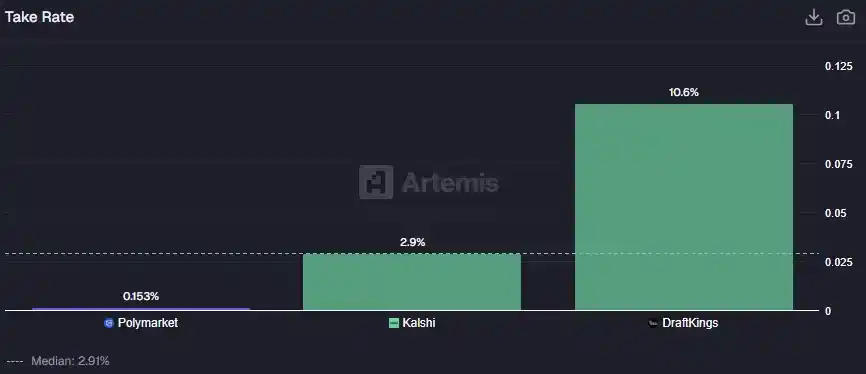
The core of the gap is the take rate—in the sports betting context, also called "hold."
DraftKings: Takes 10.57% for every dollar bet. This is the typical sports betting model—the house sets prices, provides odds, and manages risk, taking a substantial cut.
Kalshi: Takes 2.91%, as a financialized exchange model, this is lower and more in line with its positioning.
Polymarket: Only 0.15%. On $24.6 billion in volume, the revenue it can currently capture is very limited.
The conclusion is straightforward: The differentiation in prediction markets is not in "scale," but in "take structure."
<极>